ggrain - a ggplot2 extension for raincloud plots
ggrain - a ggplot2 extension for raincloud plots
Judd, N.; vanLangen, J.; Poggiali, D.; Whitaker, K.; Rhys Marshall, T.; Allen, M.; Kievit, R.
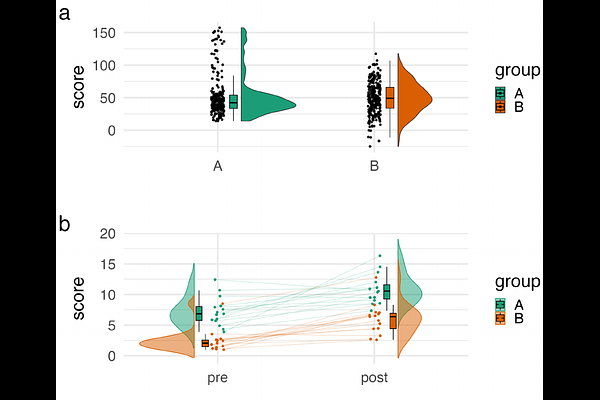
AbstractClear data visualization is essential to effectively communicate empirical findings across various research fields. Raincloud plots fill this need by offering a transparent and statistically robust approach to data visualization. This is achieved by combining three plots in an aesthetically pleasing fashion. First, a dot plot displays raw data with minimal distortion, allowing a fast glance at the sample size and outlier identification. Next, a box plot displays key distributional summary statistics such as the median and interquartile range. Lastly, a violin plot transparently displays the underlying distribution of the data. Despite the widespread use of raincloud plots, an R-package in alignment with the grammar of graphics was lacking. \'ggrain\' fills this need by offering one easy-to-use function (\'geom_rain\') allowing the quick and seamless plotting of rainclouds in the R ecosystem. Further, it enables more complex plotting features such as factorial grouping, mapping with a secondary (continuous) covariate, and connecting observations longitudinally across multiple waves.