Multifractal Fluctuations in Electrogram Dynamics Distinguish Atrial Fibrillation Phenotype, Drug Response, and Imminent Termination: Implications for Mechanism and Treatment.
Multifractal Fluctuations in Electrogram Dynamics Distinguish Atrial Fibrillation Phenotype, Drug Response, and Imminent Termination: Implications for Mechanism and Treatment.
Chapman, D. G.; Ganesan, A. N.; Strong, C.; Tonchev, I.; Lorensini, S.; Shahrbabaki, S. S.
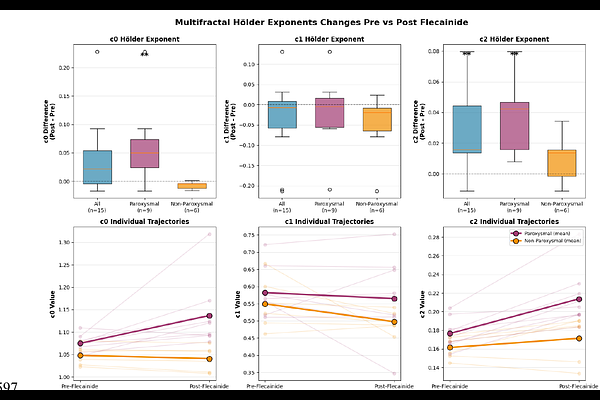
AbstractBackground Atrial fibrillation (AF) is maintained by complex dynamics, clinically characterised by bursting periods of organization and disorganization in intracardiac electrograms. We have previously postulated that cardiac conduction behaves like a critical system, where phase shift from organised rhythm to AF is a phase transition at the critical point. We thus hypothesized that using multifractal analysis of AF electrograms could potentially quantify non-stationary fluctuations, revealing novel mechanistic insights into the cardiac critical system and examine potential clinically relevant markers of AF dynamics, phenotype and treatment response. Objectives To determine whether multifractal analysis of AF electrograms can (i) Distinguish paroxysmal (PAF0 and non-paroxysmal AF (NPAF), (ii) predict response to pharmacologic modulation, and (iii) identify imminent spontaneous termination, thereby acting as marker of proximity to criticality along complex system phase spectrum. Methods We analysed >1.4 million seconds of high-density bipolar electrograms from 106 patients (paroxysmal n{approx}52, non-paroxysmal n{approx}54) undergoing left atrial mapping with a 24-bipole HD-Grid catheter at standardized sites (RENEWAL AF-ANZCTR ACTRN12619001172190)). Multifractal analysis using the Wavelet Transform Modulus Maxima Method (WTMM) was applied to a burst-energy observable to derive log-normal multifractal parameters c0 (support dimension), c1 (spectrum location), and c2 (fluctuations). Hierarchical mixed-effects models accounted for channels nested within locations within patients. A flecainide sub-study (n=15) provided paired pre/post-infusion recordings, and 27 spontaneous termination events in 15 patients were analysed using 60-s pre-termination windows. Spatial texture of c2 was quantified by variogram-derived correlation length and sill. Results AF electrograms exhibited robust multifractality confirming multifractal fluctuations as an intrinsic property of AF. Non-paroxysmal AF showed significantly reduced fluctuations versus paroxysmal AF (c2: {beta}=-0.01, p=0.001), indicating a paradoxical loss of fluctuations with disease progression. Flecainide selectively increased fluctuations in paroxysmal AF ({Delta}c2 = +0.04, p<0.01; {Delta}c0 = +0.06, p<0.01) but had no significant effect on fluctuations (c2) in non-paroxysmal AF, revealing phenotype-dependent drug response. Immediately prior to spontaneous AF termination, fluctuations increased significantly compared with sustained AF (c2: 0.198 vs 0.181, p=0.024). Spatial variogram analysis revealed heterogenous patterns in paroxysmal AF, whereas non-paroxysmal AF displayed a homogenised, flattened fluctuations landscape. Conclusions Atrial fibrillation exhibits robust multifractal dynamics rather than random electrical activity. Reduced fluctuations characterizes non-paroxysmal AF, whereas higher fluctuations is observed in paroxysmal AF, during flecainide modulation, and immediately prior to spontaneous termination. These findings suggest that multifractal fluctuations (c2) reflects the dynamical state of AF and may serve as a quantitative biomarker of disease progression, pharmacologic responsiveness, and proximity to termination.